Introduction
Back to user guide contents list
You can find SCoT at http://ltdemos.informatik.uni-hamburg.de/scot/.
SCoT was developed in the context of digital humanities to support a digital history of concepts. The aim is to provide a means to help linguists, philosophers and others interested in diachronic semantics to visualize the different senses of a word over time.

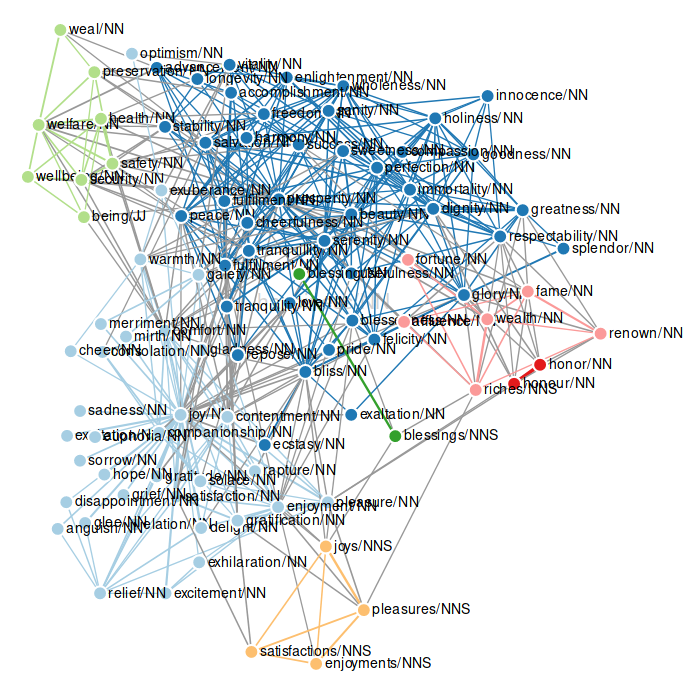
The main idea is that users enter a word they are interested in and the different senses of the queried word are displayed in a clustered graph of its paradigms for a selected time interval. Paradigms are words that appear in contexts similar to the contexts of the queried target word. The clusters are visualized via the node colours. An edge is drawn between two nodes if they are paradigms, weighted by their respective context similarity. The clusters are calculated using the Chinese Whispers algorithm and should be understood as only a first automatic hypothesis. The user can edit and correct clusters in different ways. The clustering algorithm is non-deterministic, which means that the system may provide different clusterings for the same graph if the algorithm is executed again.
Note: SCoT currently runs on a reduced database of Google Books ranging from 1520 to 2008. The data is split into eight time slices. This means that no exact years or time periods other than these time slices can be queried.
Note: Since currently I am working with a reduced database, there are only a limited number of target words available. These include: “crisis/NN”, “freedom/NN”, “happiness/NN”, “legitimate/JJ”, “revolution/NN”, “life/NN”, “public/NN”, “diversity/NN”, “theory/NN”, “history/NN”, “scandal/NN”, “experience/NN”, “bank/NN”, “sausage/NN”, “hate/NN”, “elephant/NN”, “number/NN”, “chain/NN”
General Structure

At the top, the user finds a navigation bar with different functions. Here the user can save a graph to a local JSON file and upload a previously saved graph again. The user can also view different centrality measures for the graph - one using betweenness centrality, the other highlighting nodes that are connected to more than one cluster in a balanced fashion (“hubs”). Moreover, there is search field available for looking up specific nodes in the graph. In addition, the graph can be reclustered via a navbar function. Should the user have zoomed into the graph, the zoom can be reset via the navbar. The sidebar with editing options for the graph can be toggled via a button in the navbar. More info on the functions of the navbar.
At the left side, the user finds the options sidebar. The input fields for the graph parameters are located here, as well as the general settings and a function to change the amount of nodes and edges in the graph after it has been rendered. More info on the options sidebar
To the right side the graph can be edited via the options in the togglable sidebar. The sidebar can be opened and closed via a button in the navbar. More info on the editing options
In the center of the page, the word sense graph is displayed. The user can interact with the graph in different ways.
Note: Most of the manipulation functionalities are only available in the sense clustering mode. The buttons to edit the graph are only faded in, if a graph is rendered.